

Tesla Inc. (TSLA)
Tesla, Inc. (TSLA) remains one of the world’s most volatile and discussed stocks, with Elon Musk’s political bent having made it a lightning rod of discussion. Sales continue to fall – especially in Europe – and Musk’s personal focus seems to be on many other areas. It will be interesting to see how the numbers look and what if any guidance may be given when Tesla reports on Tuesday afternoon.
Technically, shares have made a full reversal since their post-election rally and now sit poised to move again. This is not an ideal-looking chart for the bulls, as key levels of support have been breached, the near-term trend is lower, and the long-term trend is a volatile mess.
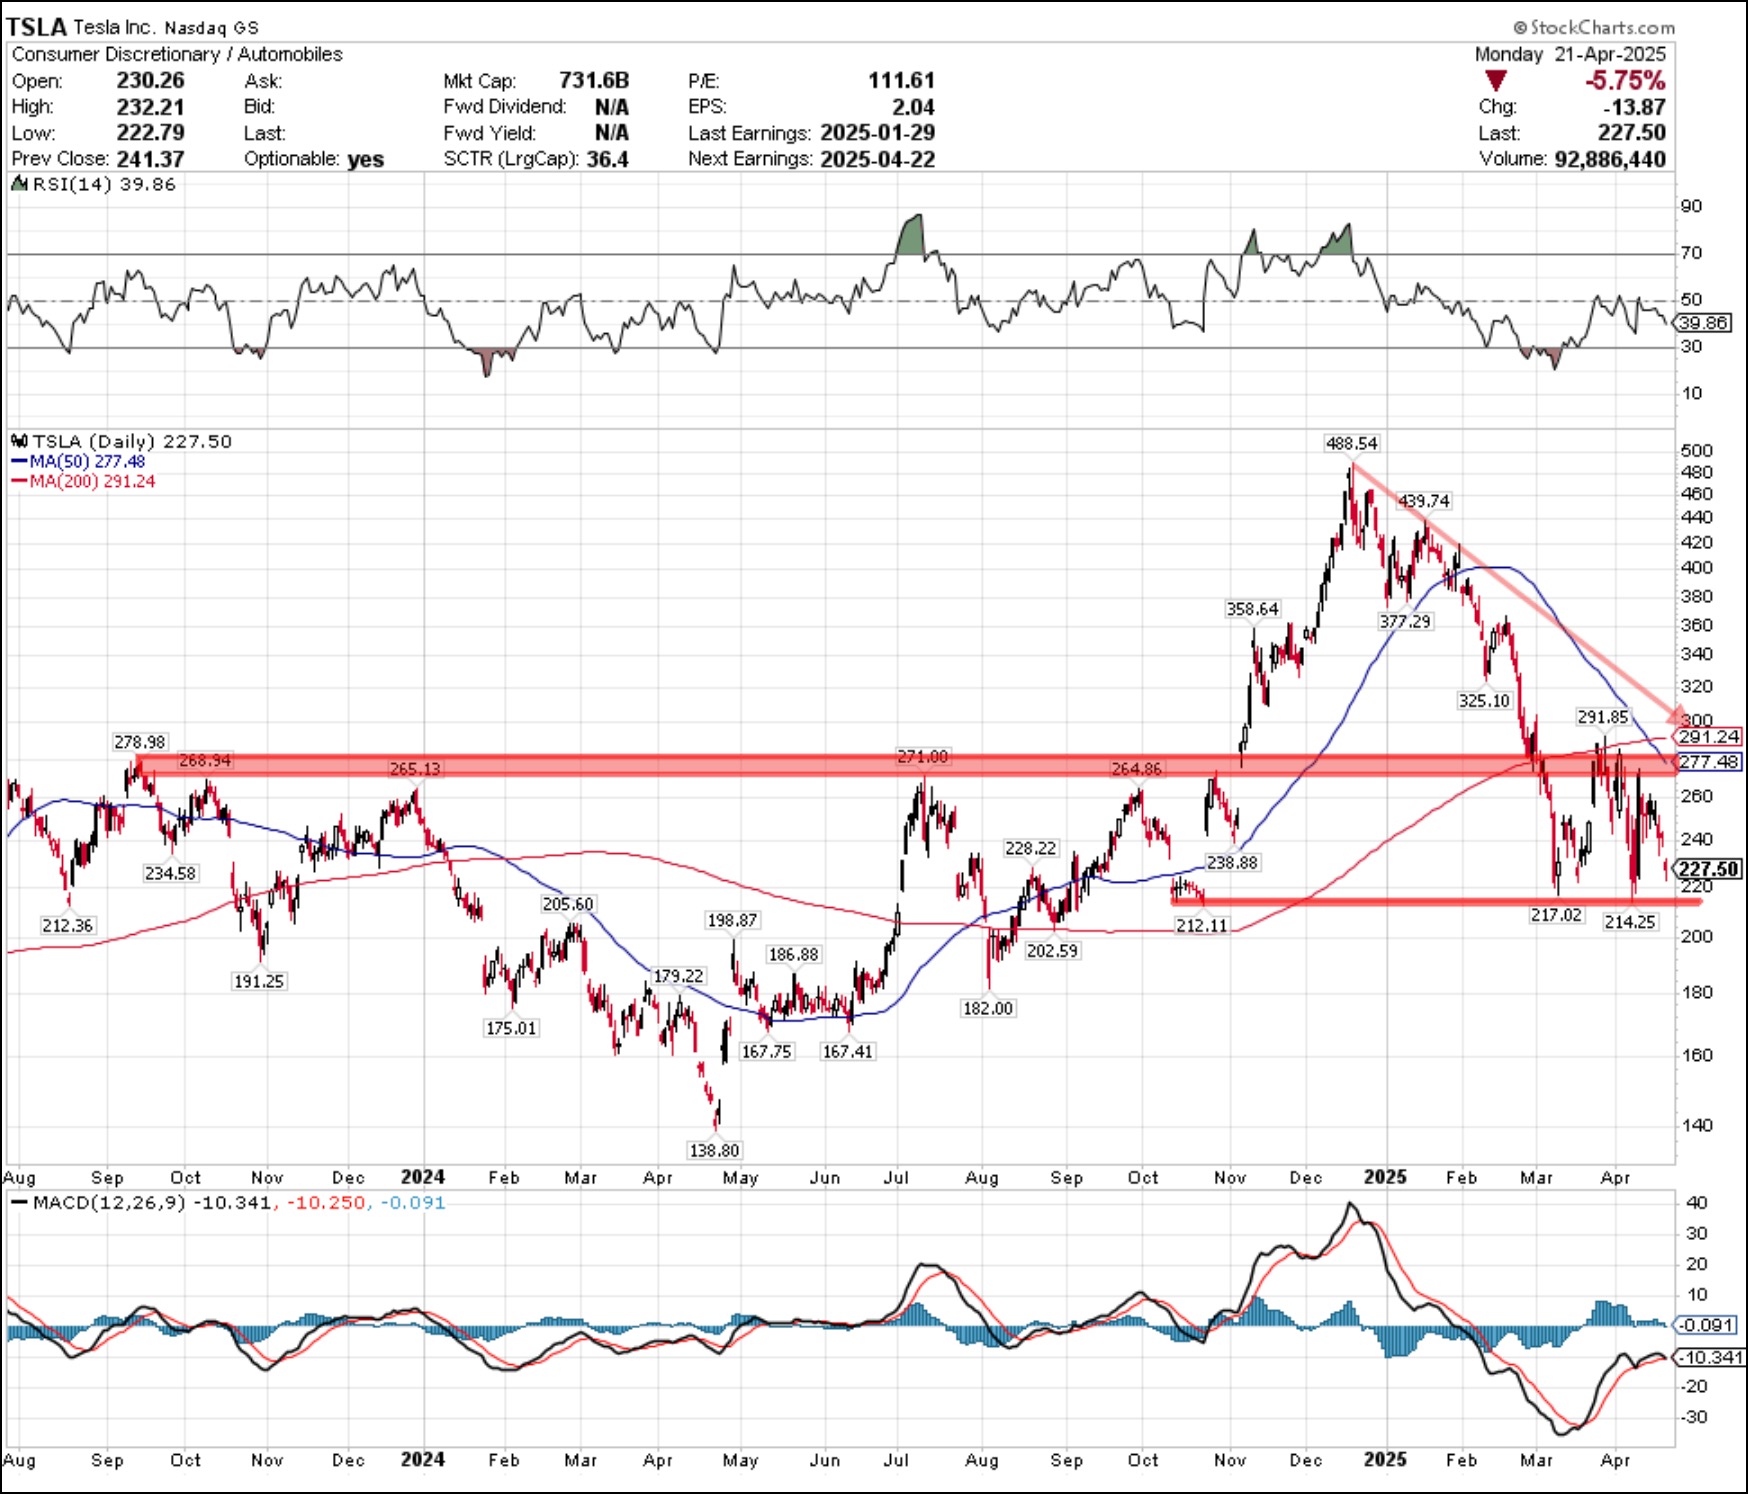
FIGURE 1. DAILY CHART OF TESLA STOCK PRICE.
Currently, there’s a descending triangle in a near-term downtrend, with a floor around $215. It has been tested twice and held, but each rally continues to be met with strong resistance. There is more overhead resistance and work to be done to get shares on the right ascending track.
During a rally, there are three levels where sellers should take charge. The first level coincides with the current triangular downtrend line and old support, now resistance, which goes back to its pre-election breakout around $270. Then there is also the 200-day moving average just over $290. Lastly, there is the downtrend from the recent highs at the $300 level.
Momentum favors the bears on any rally, and weakness could plunge the stock towards its August 2024 lows around $180. It is not an ideal risk/reward set-up going into the numbers. Both key momentum indicators — relative strength index (RSI) and moving average convergence/divergence (MACD) — appear to be stalling, which makes this stock one to avoid despite all the news it may cause later this week.
Service Now (NOW)
ServiceNow, Inc. (NOW) shares have been decimated since reporting earnings last January. The software company, the fourth-largest company in the iShares Tech-Software ETF (IGV), looks to rebound when it reports earnings after the close on April 23.
Technically, recent price action is showing signs of a bottom, and the risk/reward set-up is getting clear.

FIGURE 2. DAILY CHART OF SERVICE NOW.
The sell-off reached a crescendo after “Liberation Day” and snapped back to levels that set up a plan of attack as we go into this week’s earnings. Shares reached extreme oversold conditions on both the MACD and RSI readings before hitting recent lows. Price action on the biggest move lower showed a divergence in both indicators, and didn’t confirm that last move down.
There are two bullish divergences after a severe drawdown, which is a positive. The Fibonacci retracement levels from the beginning of the bull market to its recent peak also show a positive development. The sell-off found support right at the 61.8% “golden ratio” level, which coincided with prior support going back to the lows of 2024.
Momentum is turning, a floor seems to be apparent, and we have something to reverse – all good signs for a bull case. While the moves are rather wide, targets to the downside look to be set just above $675.
To the upside, a simple mean reversion takes shares back to their declining 50-day moving average just above $865. If it breaks above there, watch for a test of the 200-day moving average, which is another $60 higher.
If you were to believe that a solid number is coming on Wednesday afternoon, as it has in all but one quarter going back to 2018 (last quarter they missed), then it may be a good entry point to capture the upside. However, as it sits in the middle of a range, it’s more of a coin flip here. Currently, it looks as though we have a sell-off that should be bought and a rally that should be faded.
One thing we do know is that it will be interesting to see if the stock can try to recapture its longer-term uptrend in a rather tricky tape.
Alphabet, Inc. (GOOGL)
Alphabet (GOOGL) continues to make headlines as it deals with ongoing litigation in Washington and competition from search engines like ChatGPT. Shares have been under pressure all year and are at a fork in the road coming into their Thursday numbers.
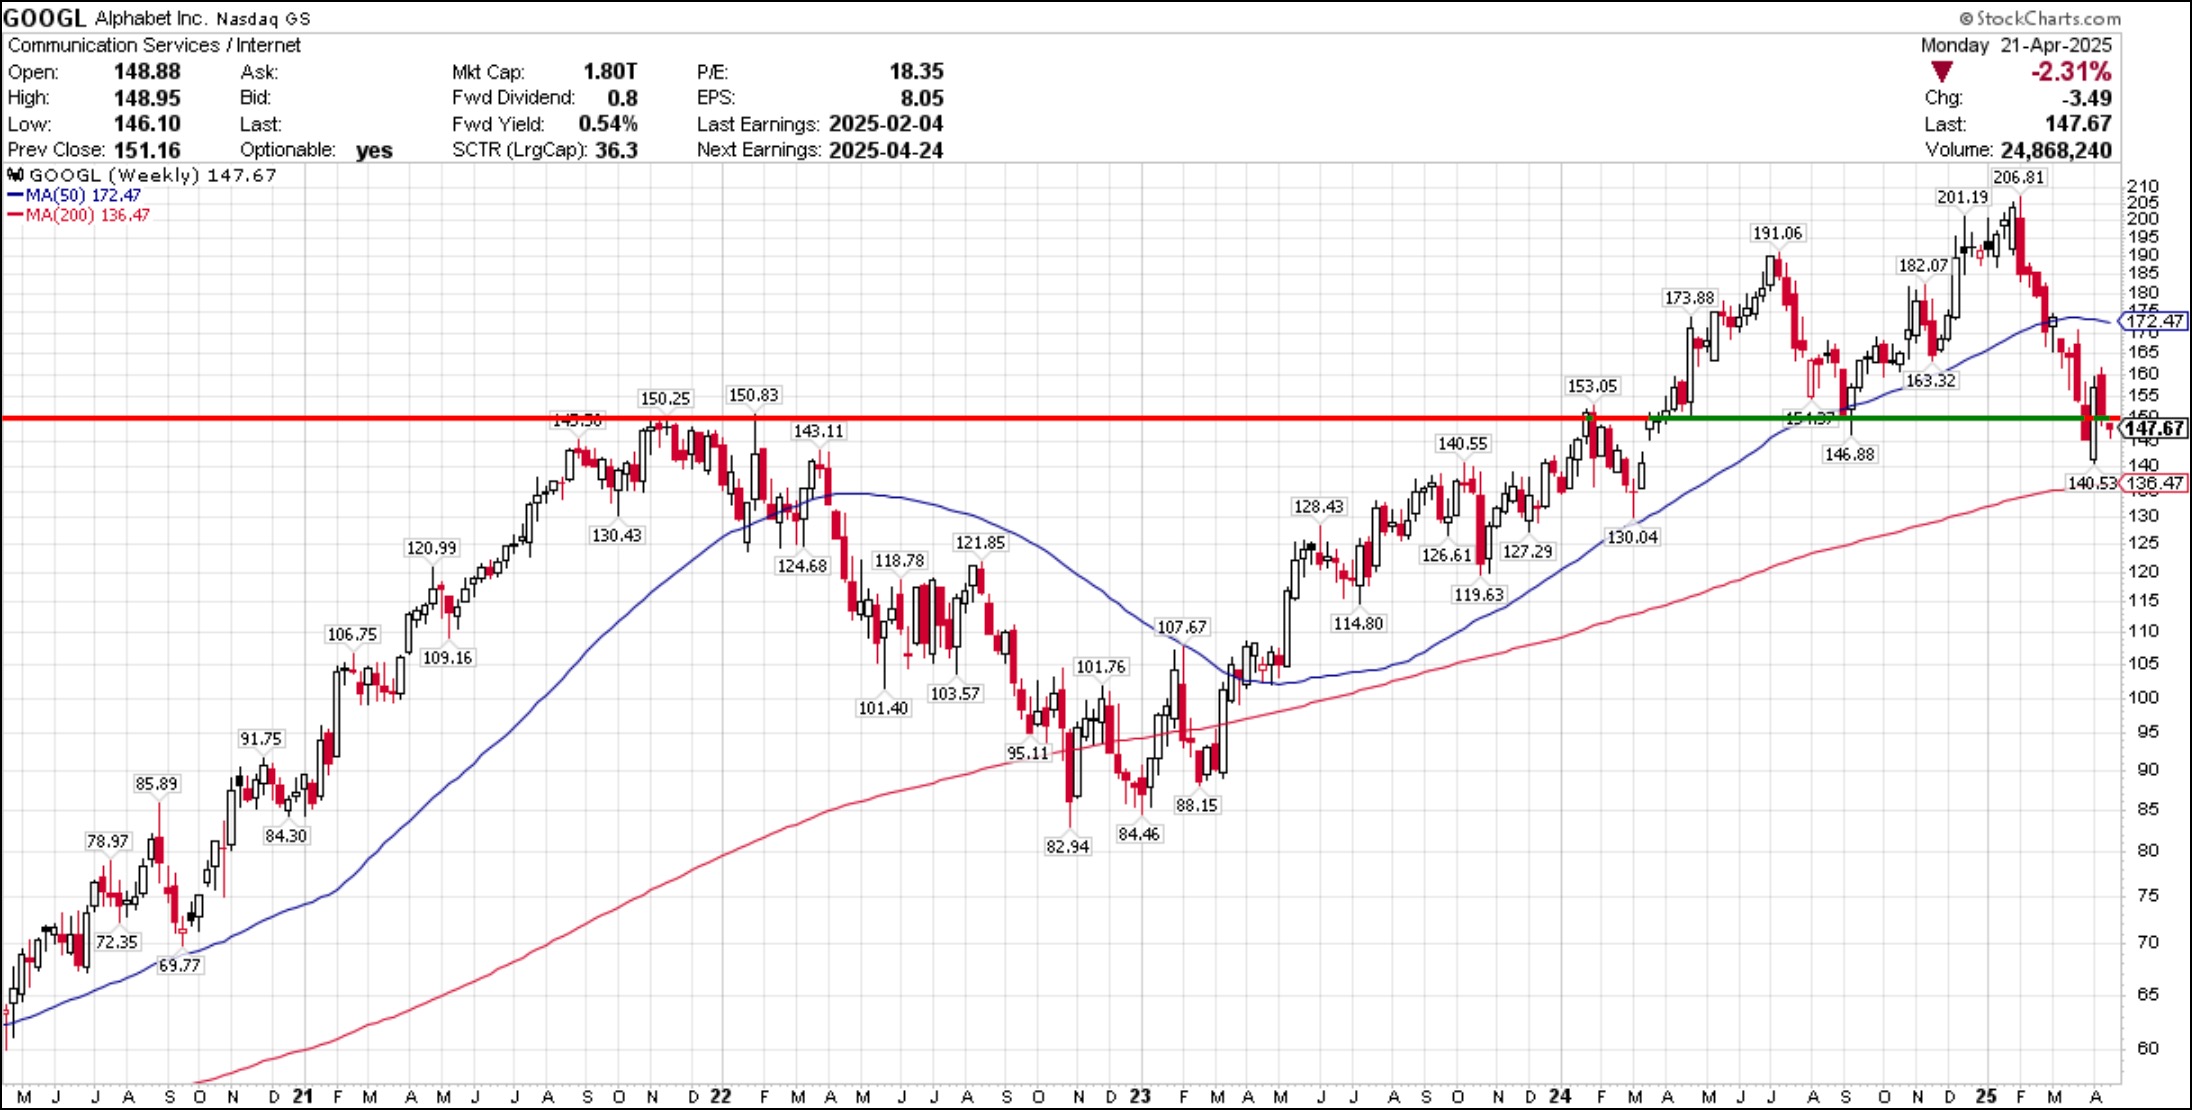
FIGURE 3. WEEKLY CHART OF GOOGL STOCK.
We kept this weekly chart as simple as possible to show this “fork-in-the-road” scenario. At the end of 2024, the chart completed a beautiful saucer bottom pattern and broke out. It almost achieved its upside targets around $220, but fell just short.
Then it broke down.
After its initial breakout, GOOGL rallied and paused. Price faded back to test old resistance after its initial leg higher. That level of old resistance became support, in textbook fashion. Shares rallied from there to make new all-time highs; then, they failed again.
Now, GOOGL sits at a key level that was tested once last week and held. Shares never closed below the key support area around $150. That sets traders up with a risk/reward scenario that seems favorable, for now. Anyone buying the stock here has two levels from which to cut their losses if price were to break down from here.
Watch the recent intraday lows at $140.50 and then the rising 200-week moving average at $136. If it closes below there, you should exit the stock and wait for a better entry point.
To the upside, there is smooth sailing to the 50-week moving average just above $172. It may take a strong beat and guide in this macro environment to push much higher, but the lines are set as we head into this busy week of earnings.